How the CAT score is calculated
Score = (3 × correct answers) − (wrong MCQ answers). A wrong TITA answer costs nothing.
| Section | Questions | Counts for percentile |
|---|---|---|
| Verbal Ability & Reading Comprehension | 24 | Yes |
| Data Interpretation & Logical Reasoning | 22 | Yes |
| Quantitative Ability | 22 | Yes |
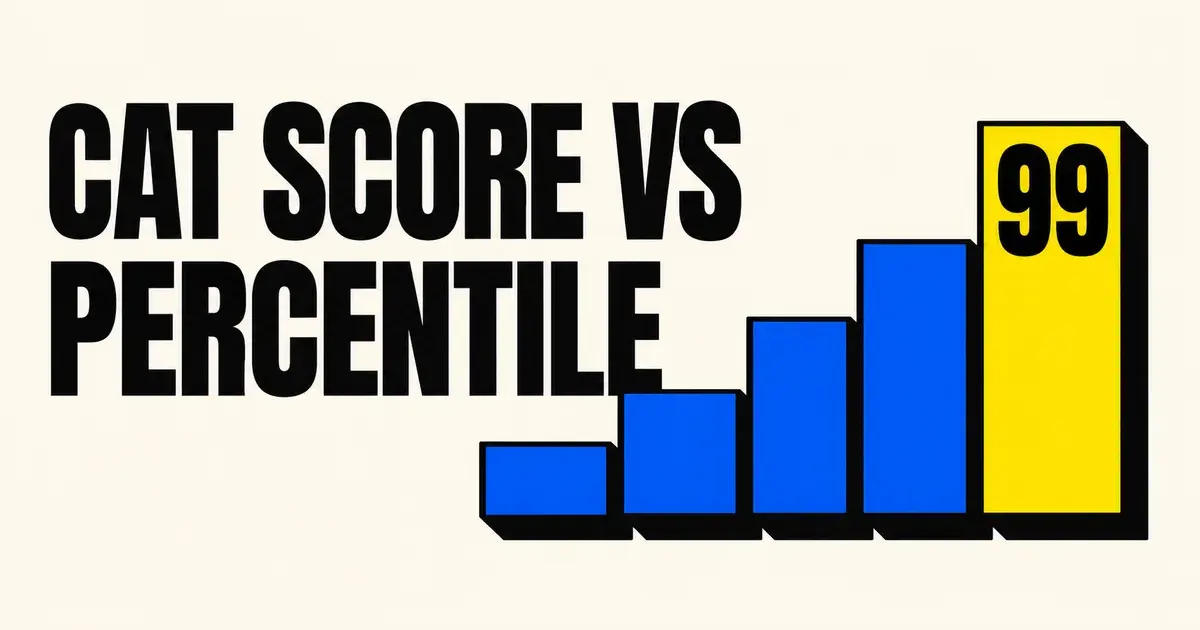
CAT 2025 score vs percentile
This is the table the calculator reads your score against. Each percentile has a low and a high mark, because sources and slots differ.
| Percentile | Marks out of 204 |
|---|---|
| 99.9 | 107 to 122 |
| 99.5 | 93 to 103 |
| 99 | 81 to 90 |
| 98 | 74 to 81 |
| 95 | 60 to 70 |
| 90 | 50 to 53 |
| 85 | 41 to 45 |
| 80 | 37 to 41 |
| 70 | 29.5 to 32 |
| 60 | 23 to 25 |
| 50 | 19 to 20 |
Estimates for the three CAT 2025 slots from IMS, Career Launcher, Cracku, 2IIM and Arun Sharma, and Cracku's table compiled after the result.
CAT 2024, for comparison
| Percentile | Marks |
|---|---|
| 99.9 | 127 |
| 99.5 | 104 |
| 99 | 95 |
| 97 | 79 |
| 95 | 70 |
| 90 | 58 |
| 85 | 50 |
| 80 | 44 |
| 75 | 40 |
Estimates compiled by Cracku. The gap between the two years shows how far the marks for one percentile can move.
How to read your result
A percentile is a rank, not a mark. It says how many test-takers scored below you. The marks behind a percentile change with the paper and even between the three slots on the same day, which is why the result is a range and not one number.
The IIMs convert raw marks into scaled scores across the three slots before they work out percentiles. Raw and scaled scores usually sit within a few marks of each other, so your raw score gives a fair estimate. The only exact figure is the one on your official scorecard.
Most IIMs also set a minimum percentile for each section. A high total with one weak section can still miss a call, so read your section marks as well as the total.
Sources
- Cracku: CAT score vs percentile
- MBAUniverse: IMS, Cracku, CL and TIME compared
- Career Launcher: CAT marks vs percentile
Figures last checked on 11 Oct 2026. They are estimates and change with every paper. Your official scorecard is the only exact figure.