How the SNAP score is calculated
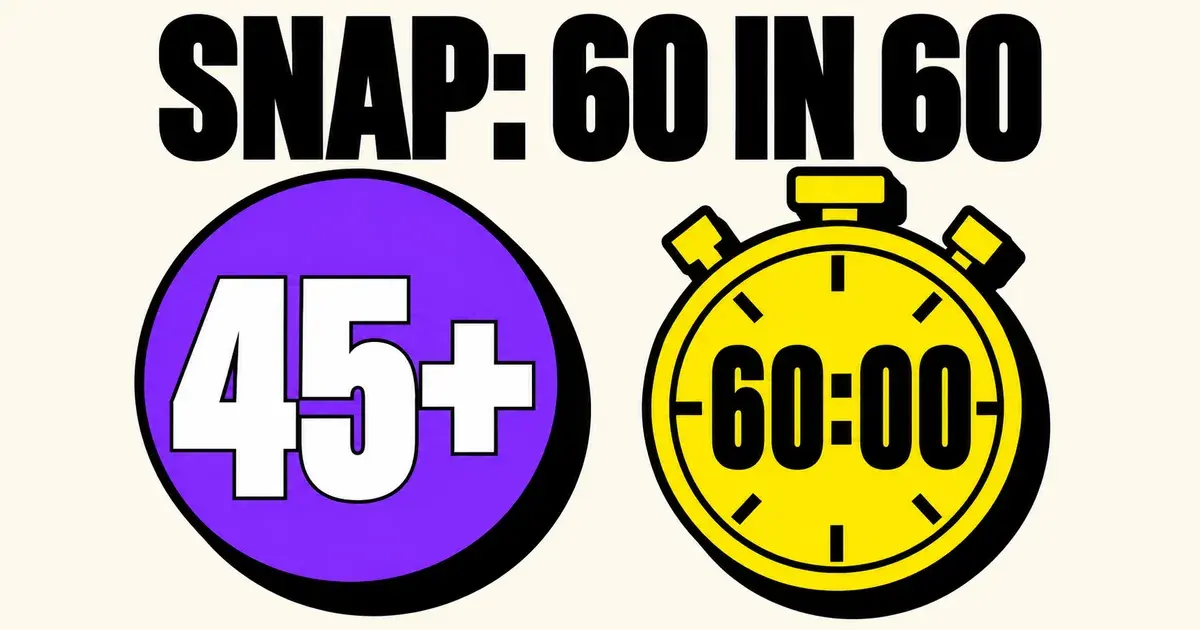
Score = correct − (0.25 × wrong). Unattempted questions cost nothing.
| Section | Questions | Counts for percentile |
|---|---|---|
| General English | 10 | Yes |
| Analytical & Logical Reasoning | 20 | Yes |
| Quantitative, Data Interpretation & Data Sufficiency | 20 | Yes |
| Ethics, Morality & Values | 10 | Yes |
SNAP 2025 score vs percentile
This is the table the calculator reads your score against. Each percentile has a low and a high mark, because sources and slots differ.
| Percentile | Marks out of 60 |
|---|---|
| 99.9 | 52.75 to 54.75 |
| 99.5 | 50.25 to 52.25 |
| 99 | 48.75 to 50.75 |
| 98 | 47.25 to 49.25 |
| 97 | 46 to 48 |
| 95 | 44 to 46 |
| 90 | 41 to 43 |
| 85 | 38.75 to 40.75 |
| 80 | 36.5 to 38.5 |
| 75 | 34.5 to 36.5 |
| 70 | 33.5 to 35.5 |
| 63 | 31 to 33 |
Score and percentile pairs from SNAP 2025 scorecards compiled by MBAUniverse and Careers360, with 1 mark of allowance either side.
SNAP 2024, for comparison
| Percentile | Marks |
|---|---|
| 100 | 50 |
| 99.8 | 45 |
| 99.2 | 42 |
| 98 | 40 |
| 97 | 38 |
| 94 | 36 |
| 90 | 34 |
| 85 | 32 |
| 80 | 30.5 |
| 70 | 27.75 |
Estimates compiled by IMS and MBAUniverse. The gap between the two years shows how far the marks for one percentile can move.
How to read your result
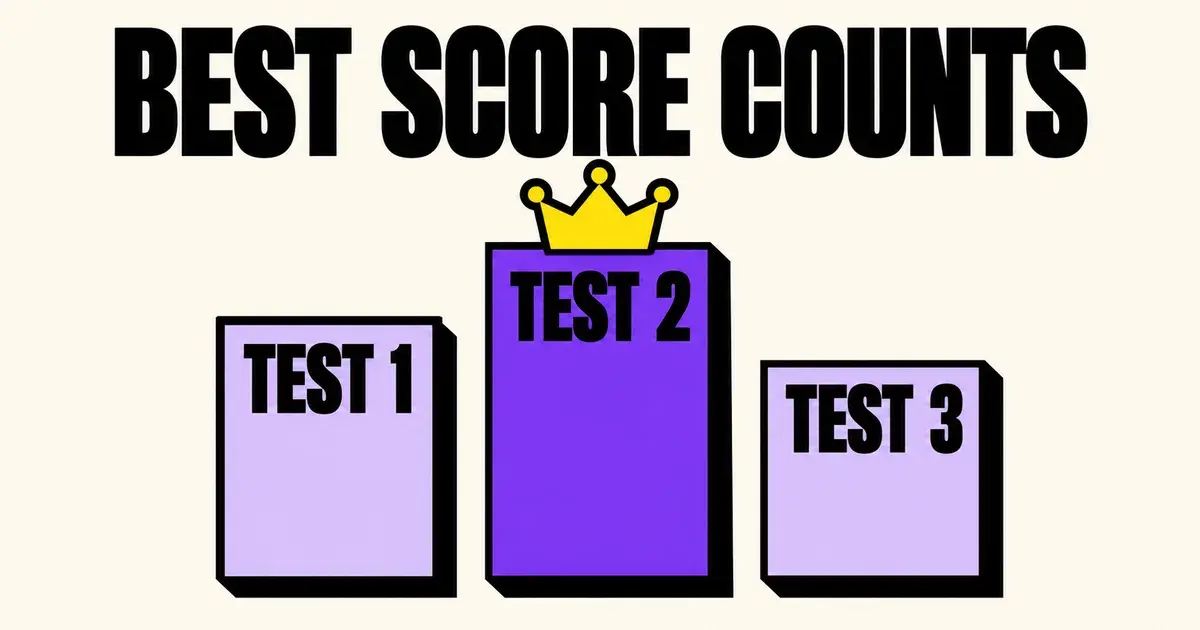
You can take SNAP up to three times in a season, and only your best score counts. Run each test through the calculator and use the highest one.
The marks behind a SNAP percentile swing more than in most exams. The 99th percentile sat near 45 marks in SNAP 2023, near 41 in SNAP 2024 and near 50 in SNAP 2025. Read the estimate with that in mind, and look at the previous-year line under your result.
The current pattern has four sections, with Ethics, Morality and Values added and fewer English and Reasoning questions. The total is still 60 questions and 60 marks, so the percentile table from the last test still applies to your total.
Sources
Figures last checked on 11 Oct 2026. They are estimates and change with every paper. Your official scorecard is the only exact figure.